As we embark into Quarter 3 of the year, it presents an exceptional opportunity to delve into the valuable insights derived from the Employment Situation Jobs Reports that made up Quarter 2, carefully curated and published by the Bureau of Labor Statistics (BLS). These reports hold the key to understanding the job market’s trajectory for the foreseeable future, as it illuminates significant revelations and discernible patterns observed in this second quarter. From unraveling industry trends regarding job openings and average wages to exploring the most sought-after sectors for hiring across the country, this comprehensive guide equips you with the knowledge to grasp the current state of the labor market.
To construct this detailed snapshot of employment, the BLS leverages two unique surveys: the household survey and the establishment survey. Delving deep into the labor force demographics, the household survey meticulously examines crucial factors such as unemployment rates and workforce participation. In contrast, the establishment survey analyzes nonfarm industries, encompassing employment rates, earnings, and hours worked.
By expanding its scope and injecting an engaging narrative, the jobs report offers a comprehensive and captivating overview of the current state of employment.

General Market Trend Breakdown
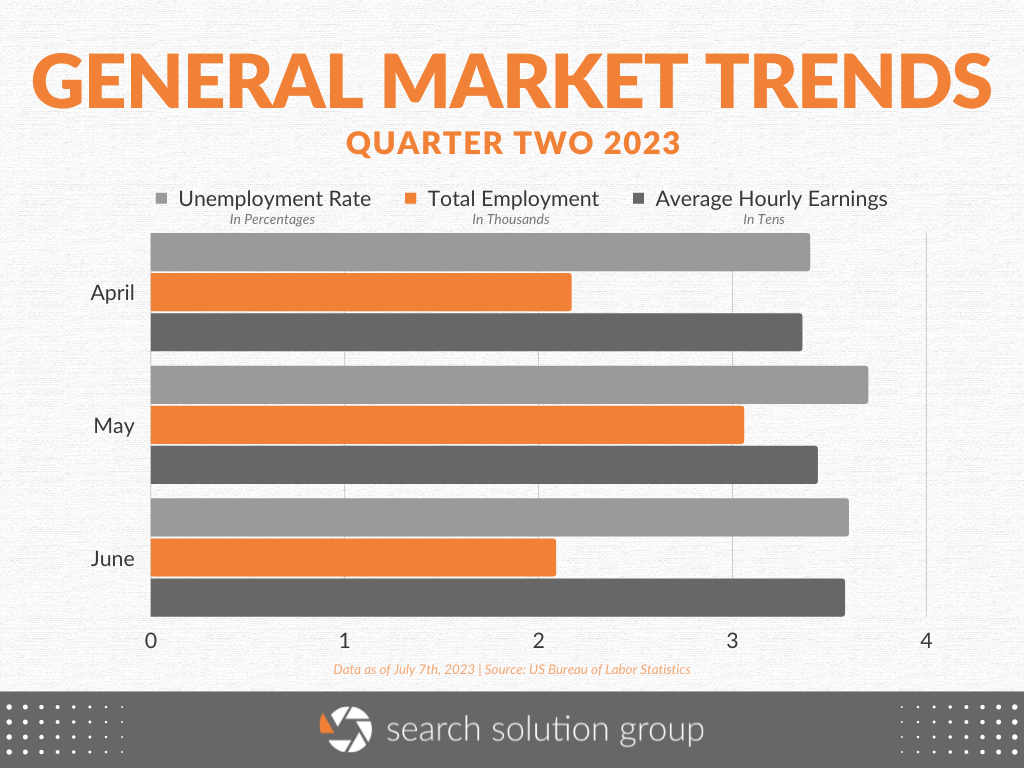
In Q2, the national unemployment rate averaged at a little over 3.5%, similar to the rate in Q1 as well as the rate from this quarter last year. May was the highest the rate has been since October of last year, with a staggering 3.7%. These rates are also like unemployment rates in 2019 and early 2020, before the COVID-19 pandemic. In the past year, the unemployment rate has not reached beyond 3.7% and has not dipped below 3.4%.
Total nonfarm payroll employment rose by 209,000 in June, which was over 100,000 fewer jobs than the previous month, after BLS updated seasonal adjustment factors. For Q2 as a whole, an average of 244,000 jobs were added each month with May being the highest once again. Since January, the total employment added has been generally decreasing with May being the exception.
While total employment is lower than anticipated, average hourly earnings have been slowly increasing for the past year. In Q2, the average hourly earnings increased from $33.36 in May to $33.46 in June. Since June of 2022, average earnings have increased a total of $1.40 per hour.
Industry-Focused Digest
The Bureau of Labor Statistics provides specific insights and employment trends across various industries each month of the second quarter. Each month, the BLS highlights the top select industries that have added the most jobs with a little detail as to which sectors within their industries are trending in employment. Based on the reports from the second quarter, here are some noteworthy highlights from these different industries:

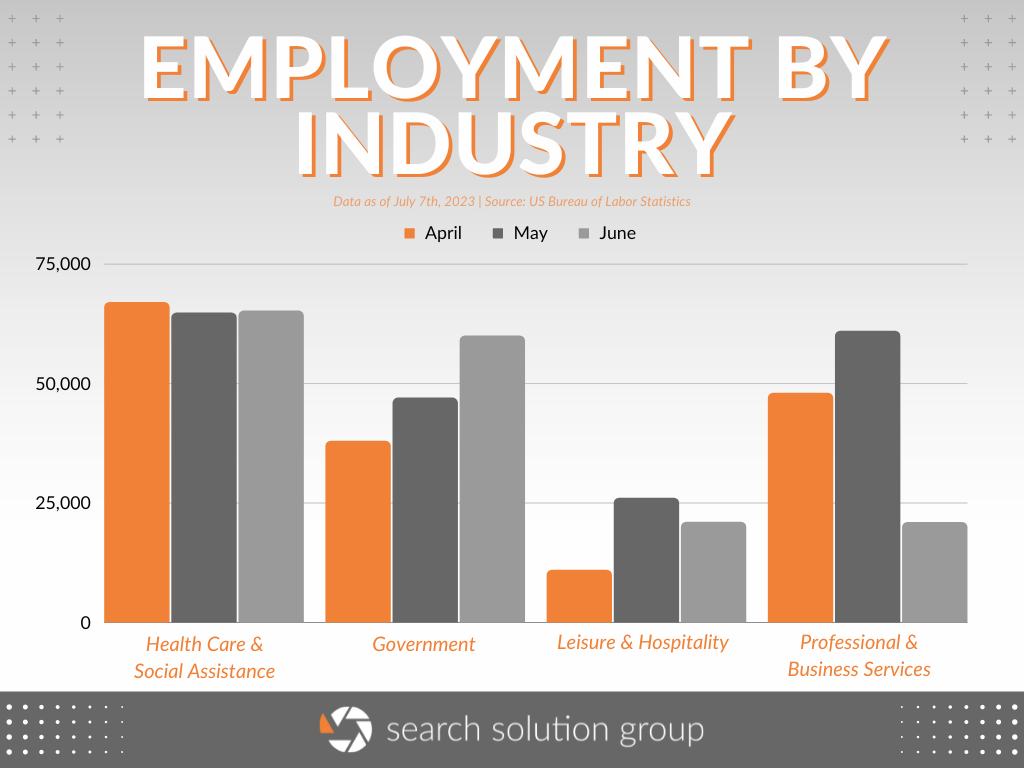
Health Care & Social Assistance added the most jobs over the second quarter, totaling roughly 197,000 jobs. This industry averaged about 65,000 added jobs per month in this quarter. Broken down, Health Care has had an average of 42,000 jobs per month thus far this year, while Social Assistance had averaged 22,000 per month thus far in 2023. Both of these rates are also in line with their respective rates in 2022. The BLS combines these two industries in their total calculations, but both sectors have significantly increased their added jobs as the quarter has gone on.
Following closely behind, Government added an incredible 145,000 jobs just in the second quarter alone, and each month added more than the next, with an average of 48,300 added jobs per month. However, even as one of the largest job contributors in the quarter, the industry has mellowed out compared to the last quarter of 2022.
The Professional and Business Services industry added the third-highest number of jobs in the second quarter, totaling 130,000 jobs. The month of May added 61,000 jobs alone, leaving the industry with an average of 43,000 added jobs per month in the second quarter. These numbers are slightly lower than in Q1 of this year, but the industry remains one of the top contributors to added jobs in the country.
The most significant change from last quarter to this quarter is within the Leisure and Hospitality industry, which only added 58,000 jobs over the entire quarter. Q1 of this year added 261,000 jobs, 203,000 more jobs than the entirety of Q2. Last year, the average monthly gain of 95,000. This industry has always been at or close to the top contributor to new jobs, so it was shocking to discover this industry at this level.
Overall, the data from the Bureau of Labor Statistics monthly Employment Situation jobs reports from the second quarter have shed immense light on the current US labor market. Though job gains were slower than they have been in the past, the pace of job growth remains strong by historical norms.
Upcoming BLS Reports for the Second Quarter
The job market can often be unpredictable and dynamic. While the monthly Employment Situation Jobs Report sheds some light on its current state, there is still much more information and valuable statistics yet to come. Over the next few months, the Bureau of Labor Statistics has scheduled the release of a variety of reports that will provide crucial insights into the second quarter. It is highly recommended to pay close attention to these selected releases to stay well informed and up to date with the latest developments in the job market.
Friday, July 21st – State Employment and Unemployment (Monthly) for June 2023
Wednesday, July 26th – State Job Openings and Labor Turnover for May 2023
Friday, July 28th – Employment Cost Index for Seconds Quarter 2023
Tuesday, August 1st – Job Openings and Labor Turnover Survey for June 2023
Thursday, August 3rd – Productivity and Costs for Second Quarter 2023
Wednesday, August 16th – State Job Openings and Labor Turnover for June 2023


