Do you find your current time reporting too rigid? Want more ways to explore your time tracking data? Need a more flexible solution to gain insights from your time tracking data?
🥁 Introducing our new customizable, flexible, and visual way to look at your time tracking data and craft custom reports — Analytics.
What is Analytics?
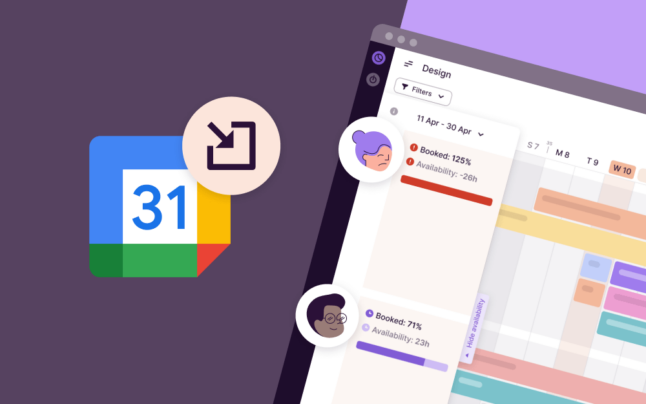
Analytics is a system of fully customizable charts and dashboards that helps slice and dice your team’s time tracking data to get deeper insights into business profitability, project efficiency, and team productivity.
Here’s a quick introduction:
Why Analytics?
Tracking your team’s time is necessary to bill clients and process payroll.
But you can do so much more with your team’s time tracking data. Managers and business owners can use this data to:
Improve project efficiency and profitability
Does the actual project effort match the estimates? How much of your team’s time is spent on billable vs. non-billable project activities? Staying on top of your team’s time tracking data and project progress ensures timely project delivery and profitability.
Manage resource demand better
Have you noticed a sudden surge of activity in a project? Do you need to move team members between projects? Or would it make sense to consider hiring more personnel? Tracking time helps you manage internal resource demands better.
Increase team productivity
When is your team most productive? What projects and clients eat up their time? Knowing how your team members spend their time is the key to improving productivity.
Most reporting functionality comes with ready-made reports that aren’t flexible. These reports feel rigid, lack customization options, and are not interactive. As a result, teams often have to export their time tracking data and process it before turning it into insightful reports.
That’s where Analytics comes in.
Key features in Analytics
Analytics allows you to create custom charts and dashboards based on your business needs. This way, you gain more insights into how your team spends time.
Custom charts

Charts are the basic blocks for building reporting dashboards. They allow you to visualize your tracked time in different ways, including:
- Tables
- Pivot tables
- Bar charts
- Donut charts
- Line charts
Customization options for charts
The new Analytics offers an array of customization options for its charts.
For starters, you have the flexibility to group and filter chart data. You can also apply custom rounding to time intervals and adjust the date, time, and currency formatting.
Some charts offer additional data presentation features. For instance, with the table chart, you can easily display totals, as well as add, edit, remove, or re-order columns.
Custom dashboards
You can use the charts you’ve already created to build custom dashboards. And just like charts, you can create, edit, or delete dashboards.

In addition to charts, dashboards can also include widgets.
By default, a dashboard features the “Totals” widget, which offers a concise summary of your data, including total tracked time, billable hours, amounts, as well as trends and averages. You can hide or display this widget depending on your reporting preferences.
We’re working on adding more such widgets in the future.
How to get started with Analytics?
For more detailed documentation, refer to this knowledge base article about Toggl Analytics.
1. Access the new Analytics
Log in to your Toggl Track account, then access Toggl Analytics by clicking on the “Analytics” menu in the left sidebar.

All organizations using Toggl Track will get free access to Toggl Analytics for the first two months from the date of the public launch. After this period, your access will depend on your organization’s subscription plan.
To make things easy, you get access to ready-made dashboard and chart templates. These dashboards are very similar to the existing Summary, Detailed, and Weekly reports available in Toggl Track today.
2. Create a custom chart
Charts are the building blocks of a dashboard.
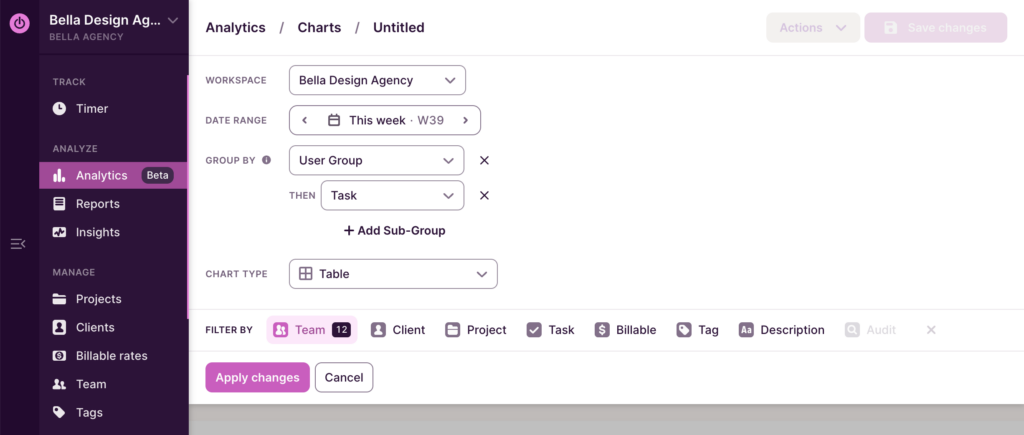
To create a custom chart:
- Navigate to the “Charts” tab. Then click on the “New chart” button. You can also start from a template and edit a chart.
- Configure the chart data, including grouping and filtering options.
- Select the Chart type (Table, Pivot table, Bar chart, Donut chart, or Line chart).
- Click on the “Create chart” button to review the chart.
- Finally, add the chart title and Description.
Once created, you can pin frequently used charts. You can also edit or completely delete them.
3. Create a custom dashboard
A dashboard is a collection of widgets and charts.

Dashboards, like charts, are customizable too. You can arrange charts on a dashboard, choosing between full or half-width, and reorder them to show important information up top.
To create a custom dashboard:
- Navigate to the “Dashboards” tab. Then click on the “New dashboard” button.
- Add the charts to the dashboard.
- Finally, add the dashboard title and description.
Example use cases
So, what can you do with the new Analytics that you can’t with the existing reports? Here are some examples:
- Create a pivot table to oversee your team’s work hours during a week, month, or quarter.
- Turn this table into a pie or a bar chart for the client who struggles to make sense of your report data.
- Use these visual charts to present time tracking insights.
- Build more complex tables and charts by grouping time entries by clients, projects, or tasks at multiple levels.
- Make your reports simpler by removing unwanted data and keeping only what your clients want to see.
FAQs
Is Analytics a paid feature?
Yes. However, you can test it for free. All organizations using Toggl Track get free access for two months from 25 October 2023. After this period, access depends on your organization’s subscription plan.
Will Analytics replace Toggl Track’s current reports?
Yes, eventually. However, for now, Analytics will exist alongside current Reports while we add more features.
What are the advantages of Analytics over existing Toggl Track reports?
Our existing reporting features provide valuable insights, though they come with limited customization and flexibility. The new Analytics elevates this by allowing you to create and tailor charts and dashboards. As a result, you can visualize data in any way you want and gain deeper insights.
What more features will Analytics have?
It’s up to you! We’re developing Analytics based on the user feedback we receive. If there is a feature you’d like Analytics to have, let us know using the in-app feedback form or get in touch with our Support team.
Try the new Analytics
Sign up now to try the new Analytics feature free for the next two months.

Jitesh is an SEO and content specialist. He manages content projects at Toggl and loves sharing actionable tips to deliver projects profitably.