Your Hiring Pulse report for November 2021
In October’s Hiring Pulse, we wrote that we’re more in a “new time” as opposed to a “crazy time” when it comes to hiring, retention, and overall business. The Big Quit – and all its related phenomena, including Striketober – has been covered ad nauseum over the last few months.


But what you really want to know is: what does this mean for your hiring? As an SMB, you just want to fill the roles you need to fill, and fast (good news on that, by the way – read on).
We know that data trends are important to you when recruiting in the SMB world. You and your hiring team want to know whether the trends you’re seeing in your own processes are ‘normal’. Because there’s no real ‘normal’ anymore, we’re moving away from traditional year-over-year and month-over-month data analysis and instead taking a fresh approach so you can make the most informed decisions as an SMB employer when assessing your own data.
How we’re looking at data
Remember, we’re looking at trends here. This means we’re showing data as a percentage increase or decrease when compared with the average of the three months previous. Jump to the end for a detailed methodology of how we’re doing this.
As always, we look at the worldwide trends for three common SMB hiring metrics:
- Time to Fill (TTF)
- Total Job Openings
- Candidates per Hire (CPH)
And we dive deeper by looking at the data in five broad regions to see how the data differs in each. Now, let’s get into the numbers.
Table of Contents:
- Time to Fill
- Total Job Openings
- Candidates per Hire
- What’s going on here?
- Regional metrics
- Conclusion
- The Hiring Pulse: Methodology
Main highlights
The three main highlights for this month’s Hiring Pulse are:
- Time to Fill is still dropping sharply despite SMB employers saying they’re having problems finding candidates
- Job openings are continuing to rise going into Q4 – as predicted in a recent Manpower report
- SMBs in Latin America are having a strikingly different experience than the four other major economic regions when it comes to hiring
1. Time to Fill
For this report, Workable defines “Time to Fill” as the number of days from when a new job is opened to when that job opening is filled. It’s important that we understand this distinction with this graph updated to September: if a job is opened in July but isn’t filled until October, it won’t count in this graph’s dataset. If another job is opened on the same day in July but is filled on the last day of September, it does count in this graph.
That *might* explain some of the downward trend in recent months, especially for jobs opened and filled within September – but it’s still not the only factor.
Let’s look at the trend graph for overall Time to Fill up to and including the month of September.
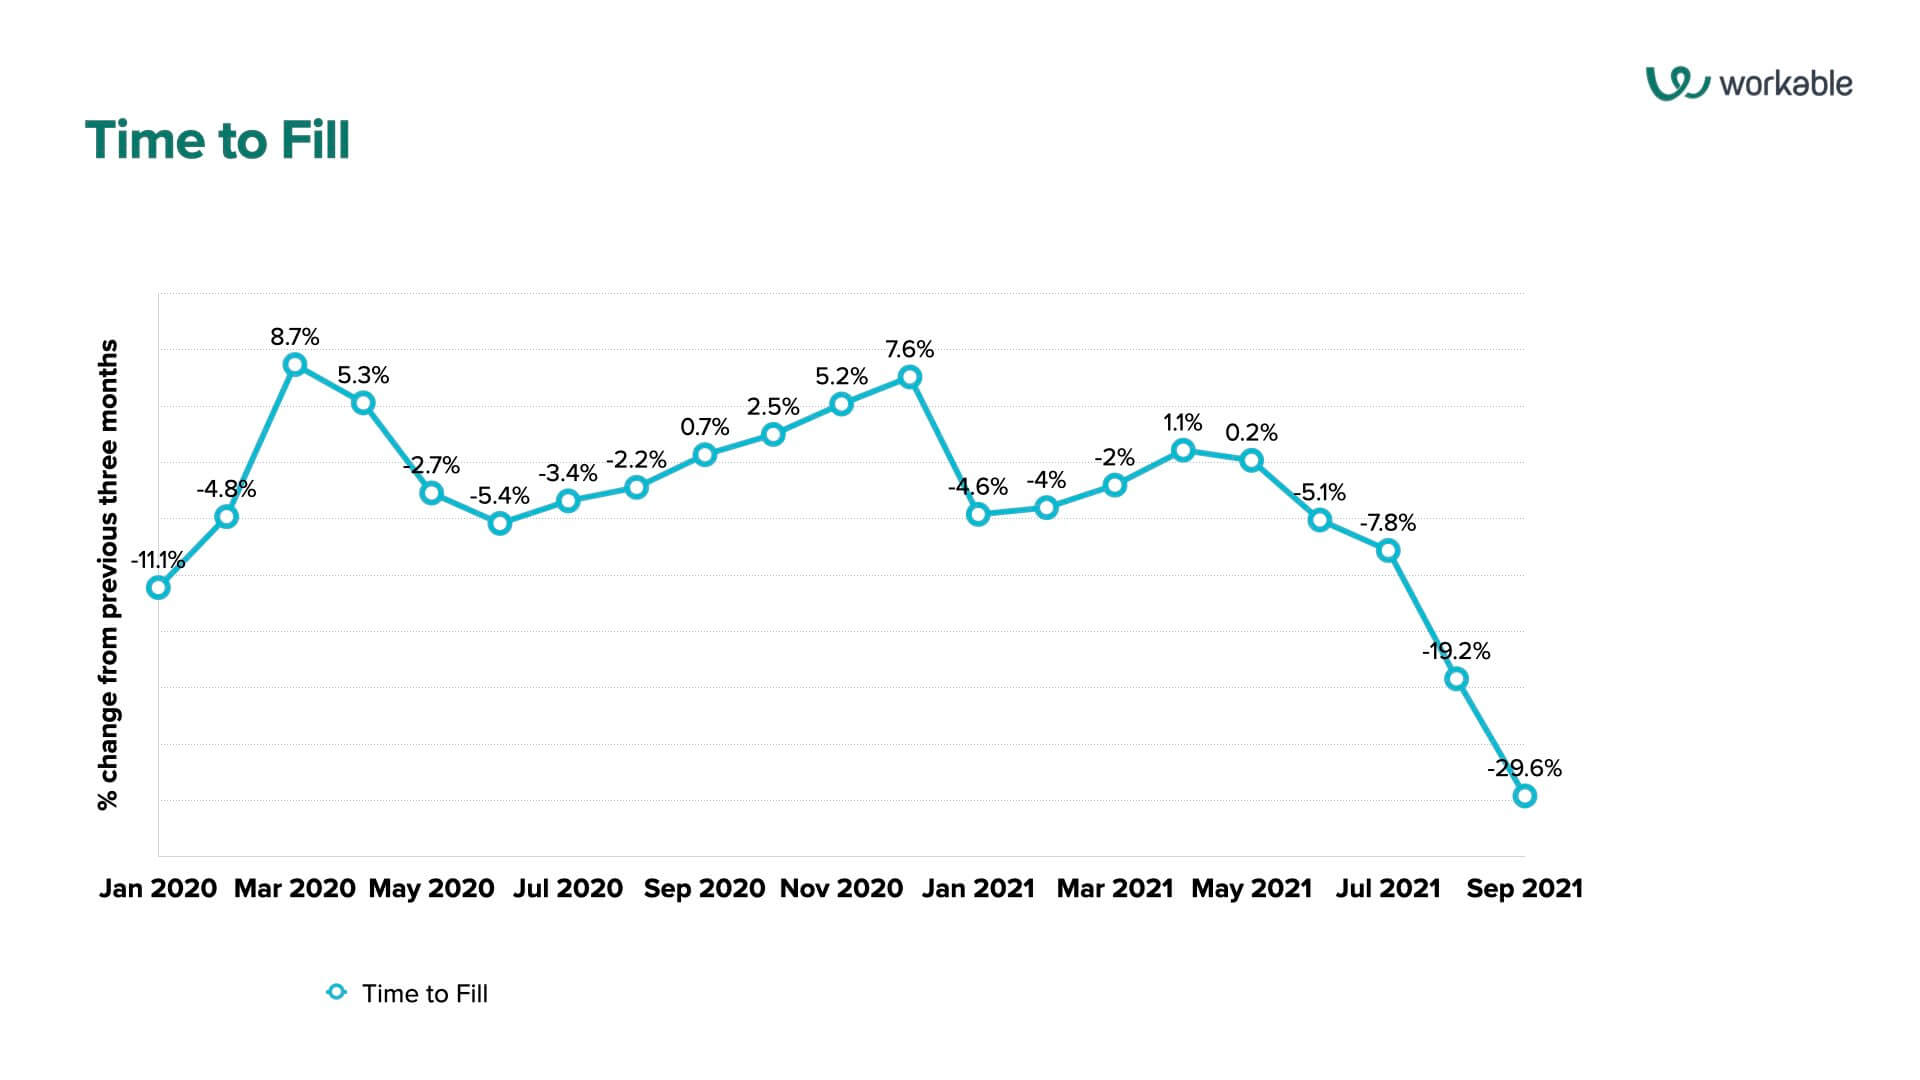
Note the dramatically negative TTF trend in August 2021 (a -19.2% shift compared with the May-June-July average – followed by an even more substantial drop of -29.6% in September 2021 compared with the June-July-August average.
That’s interesting, isn’t it? Just when you think it’s going to bottom out, this metric just keeps trending further downwards. TTF has been negatively trending for four months in a row going back to June – and seven of the last nine months. Employers are hiring faster and faster now.
Good news? Sure, let’s look at it that way. There are two reasons why it could be good:
First, and perhaps obviously, employers are succeeding in finding – and hiring – the right candidates for their open roles, at a torrid pace. That does contrast with the popular and legitimate narrative that businesses are having a hard time finding people, though. That deserves a more in-depth discussion elsewhere, so let’s set it aside for now.
Second, one of the biggest candidate gripes – on Reddit, for instance – is what they see as an excessively long recruitment process. So… the shorter TTF can be seen as good for candidates as well.
2. Total Job Openings
Total job openings represent the total number of job openings activated across the entire Workable network.
Let’s look at job openings overall, bearing in mind that these are raw job open numbers that aren’t contingent on open/close dates. So, we can include October in this chart.
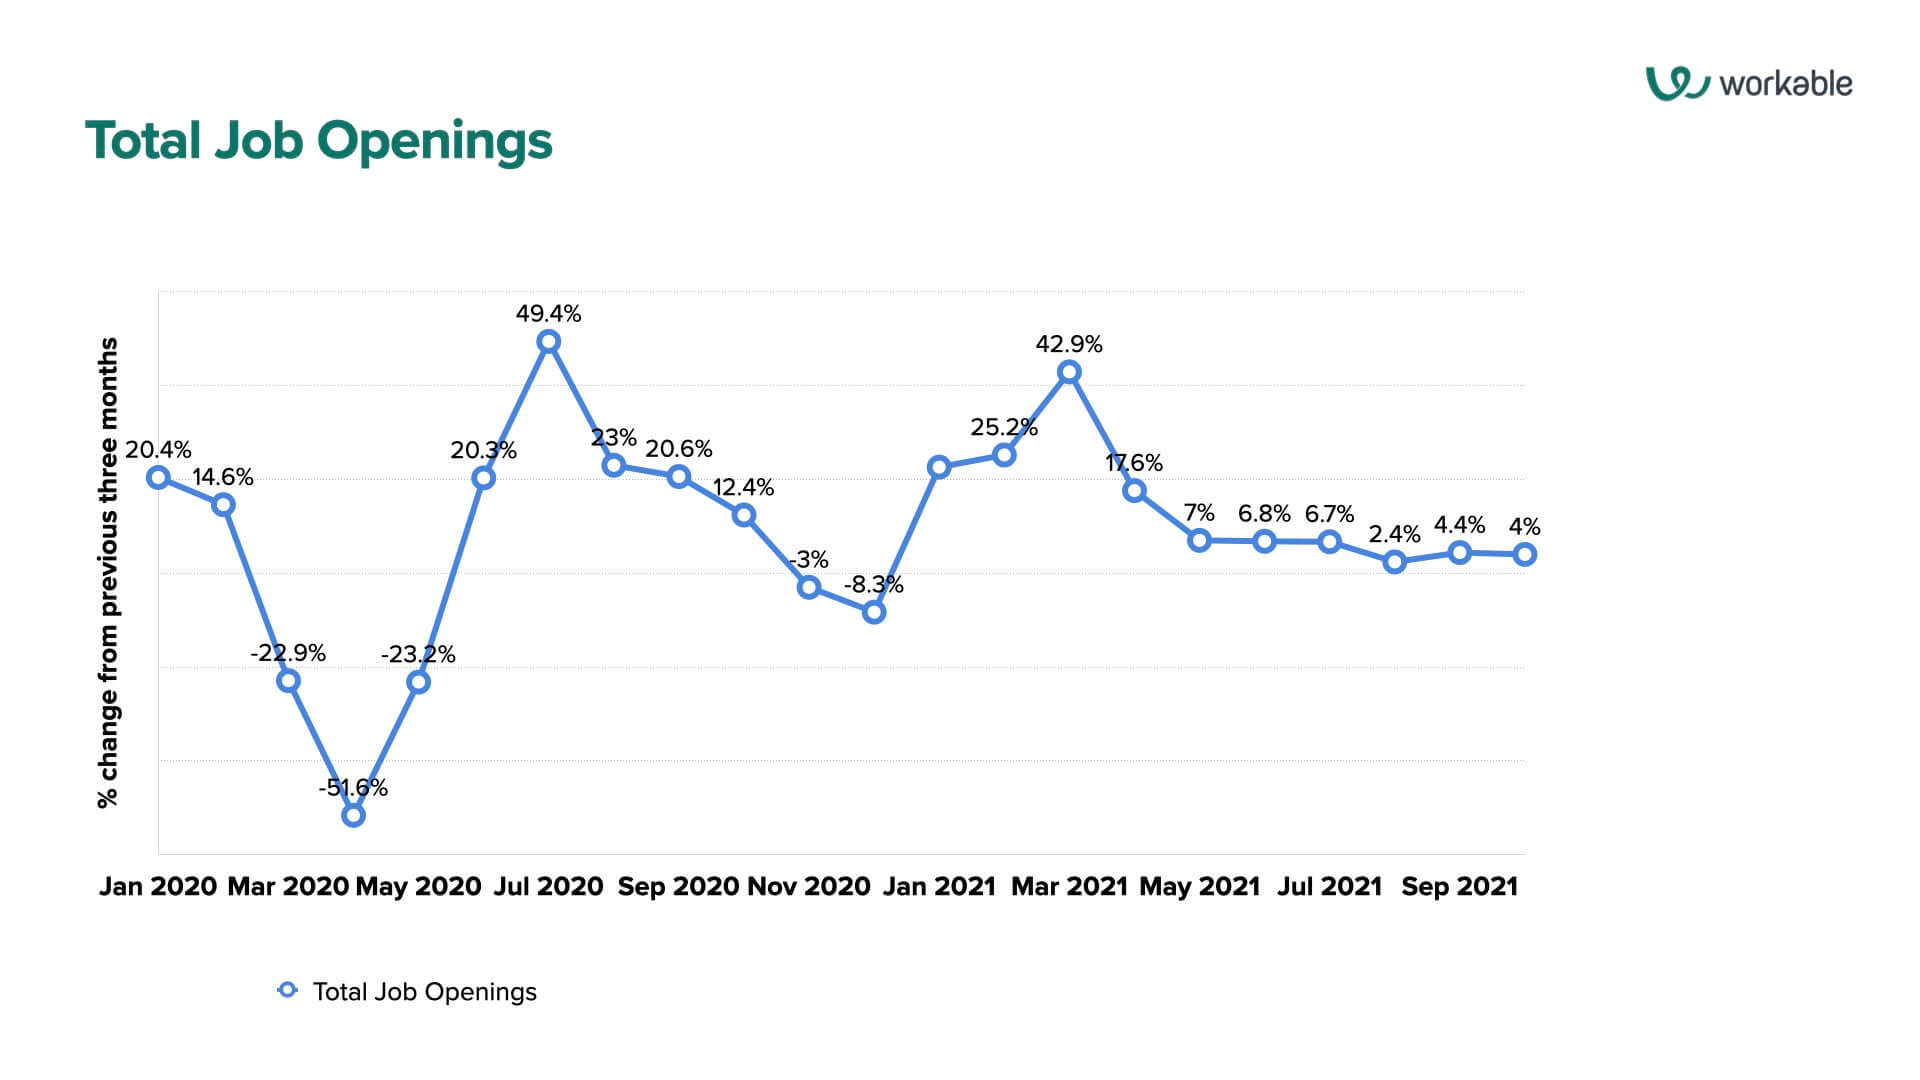
Last month, we pointed out the modest uptick in job opening trends in September 2021. We’re seeing the same for October 2021, with another 4% increase, after a 4.4% growth in job opening trends in September.
Some insight to add to that: In the United States, we’ve just seen a huge upturn in payroll for October that beat previous expectations by a good margin – with the unemployment rate at a new low since the start of the pandemic. And quit rates were still surging as of September – we won’t see quit data for October from the US Department of Labor until a bit later. But more likely, the trend of the last two months is simply skewed by August’s 2.4% trend, the lowest of any month in 2021.
Still, it’s clear: while there’s reason for optimism, this all shows considerable volatility in the job market. Not what SMB employers want to see, honestly. They’d rather hire the right people and have them stick around.
3. Candidates per Hire
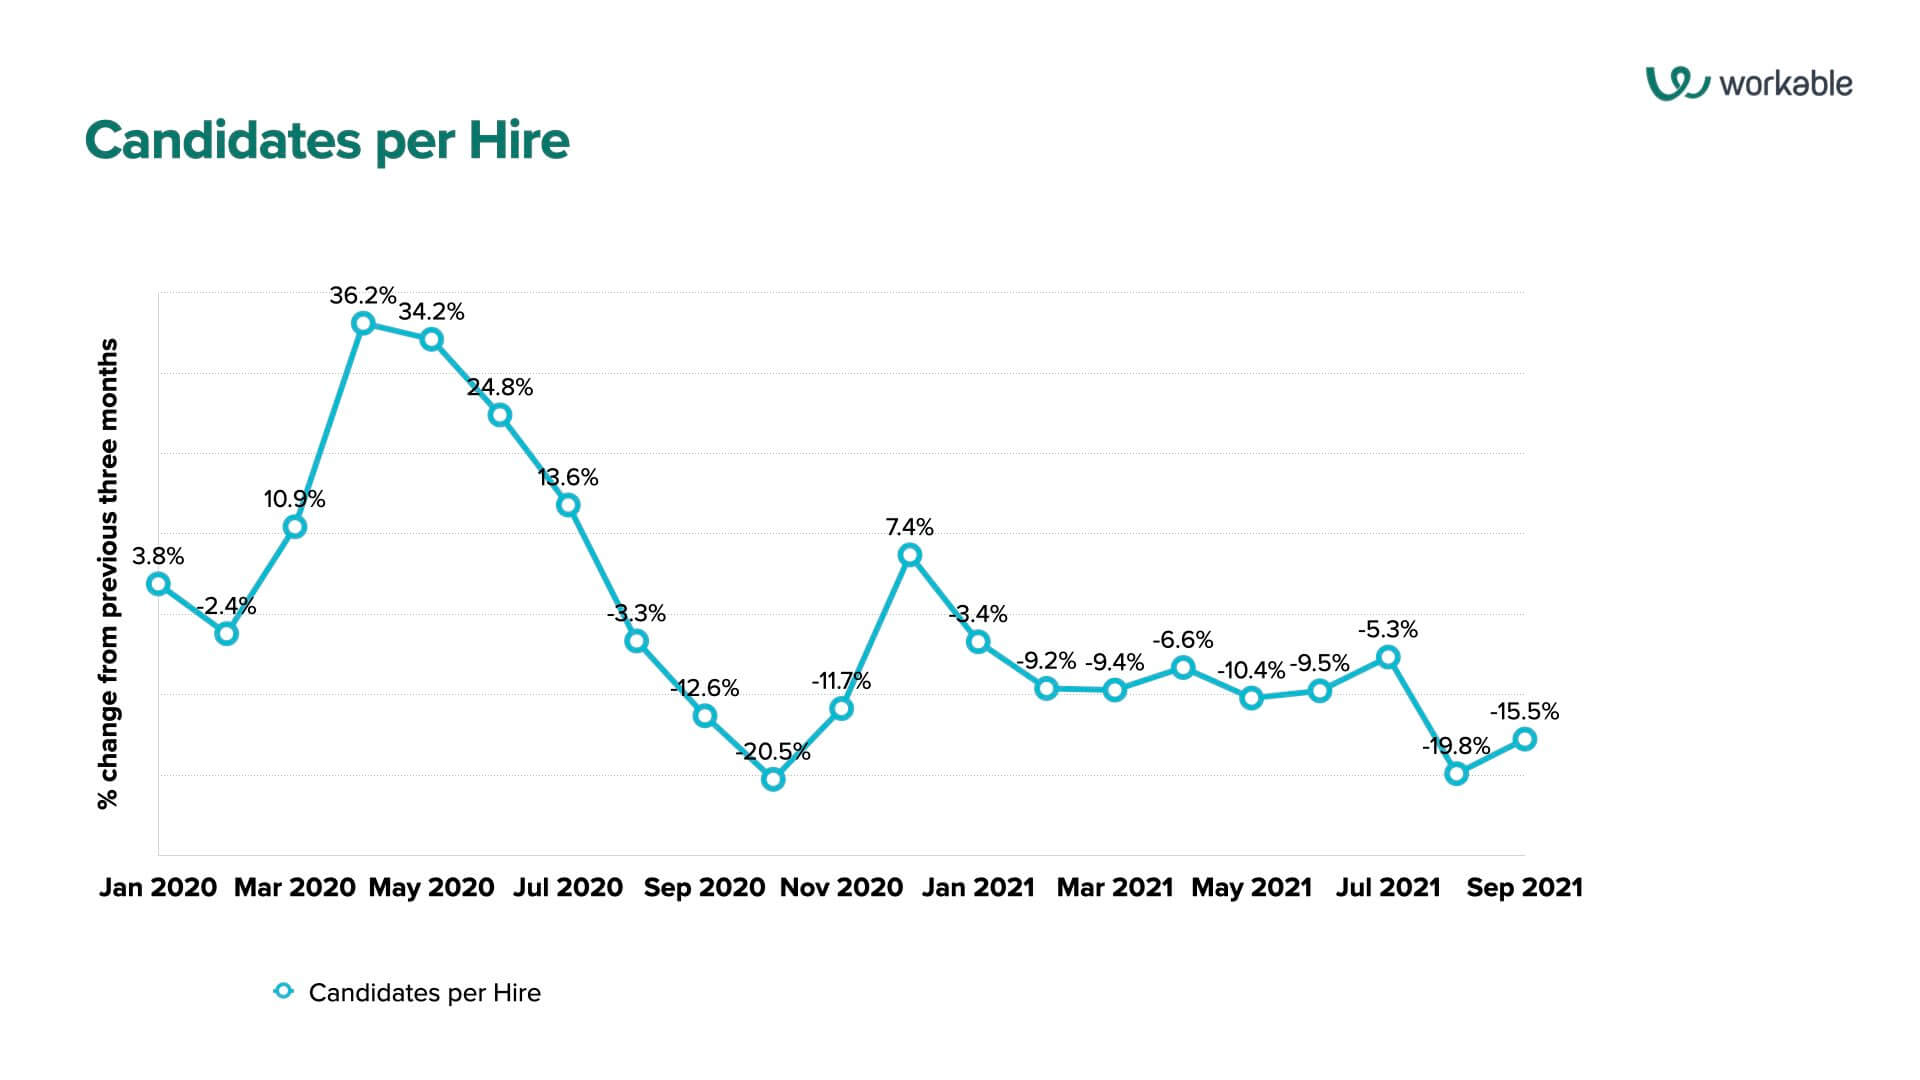
Workable defines the number of candidates per hire (CPH) as, succinctly, the number of applicants for a job up to the point of that job being filled. Let’s look at what’s going on in the numbers through September:
(NOTE: Again, as in the TTF chart, you’re probably wondering why we stopped the numbers in September. Again, as stated above, that’s because these data are based on the time the job was opened, not when it was filled.)
Last month, we pointed to the sharp drop in the CPH trend – but there’s modest recovery in that area. September 2021’s the drop in CPH actually slowed down from a 2021 low of -19.8% to -15.5%.
Regardless, CPH is still trending downwards – just not nearly as much as before.
What’s going on here?
So, this begs the question: if job openings are surging and CPH continues to trend downwards, how is it that Time to Fill is growing shorter all the time? There’s one potential explanation:
Candidates are more deliberate in their applications. Perhaps we’re no longer seeing hundreds of applications thrown around like confetti, leading to recruiters’ inboxes being overfilled with irrelevant resumes.
Instead, we’re seeing jobseekers being more targeted in their job hunt as we see a greater tendency to pursue the things that really matter as a result of the pandemic. Also, it’s a candidate’s market, so they can be more precise and pursue the job they really want rather than going the route of “any job will do”.
And, in turn, they’re probably highly motivated – and even more qualified – for those jobs.
So, SMB employers benefit: they’re getting more concentrated pools of better qualified applicants for their open jobs – so hiring becomes a quicker process from job opened to job filled.
4. Regional metrics
Of course, the world is not one single economic entity. Different things happen in different areas, ultimately leading to different outcomes in recruitment data.
So, let’s look at things at a very high level, looking at the above metrics for five broad regions:
- Asia-Pacific (APAC)
- Europe-Middle East-Africa (EMEA)
- Latin America (LATAM)
- North America (NA)
- UK & Ireland (UK&I)
Time to Fill
First, let’s have a look at Time to Fill:
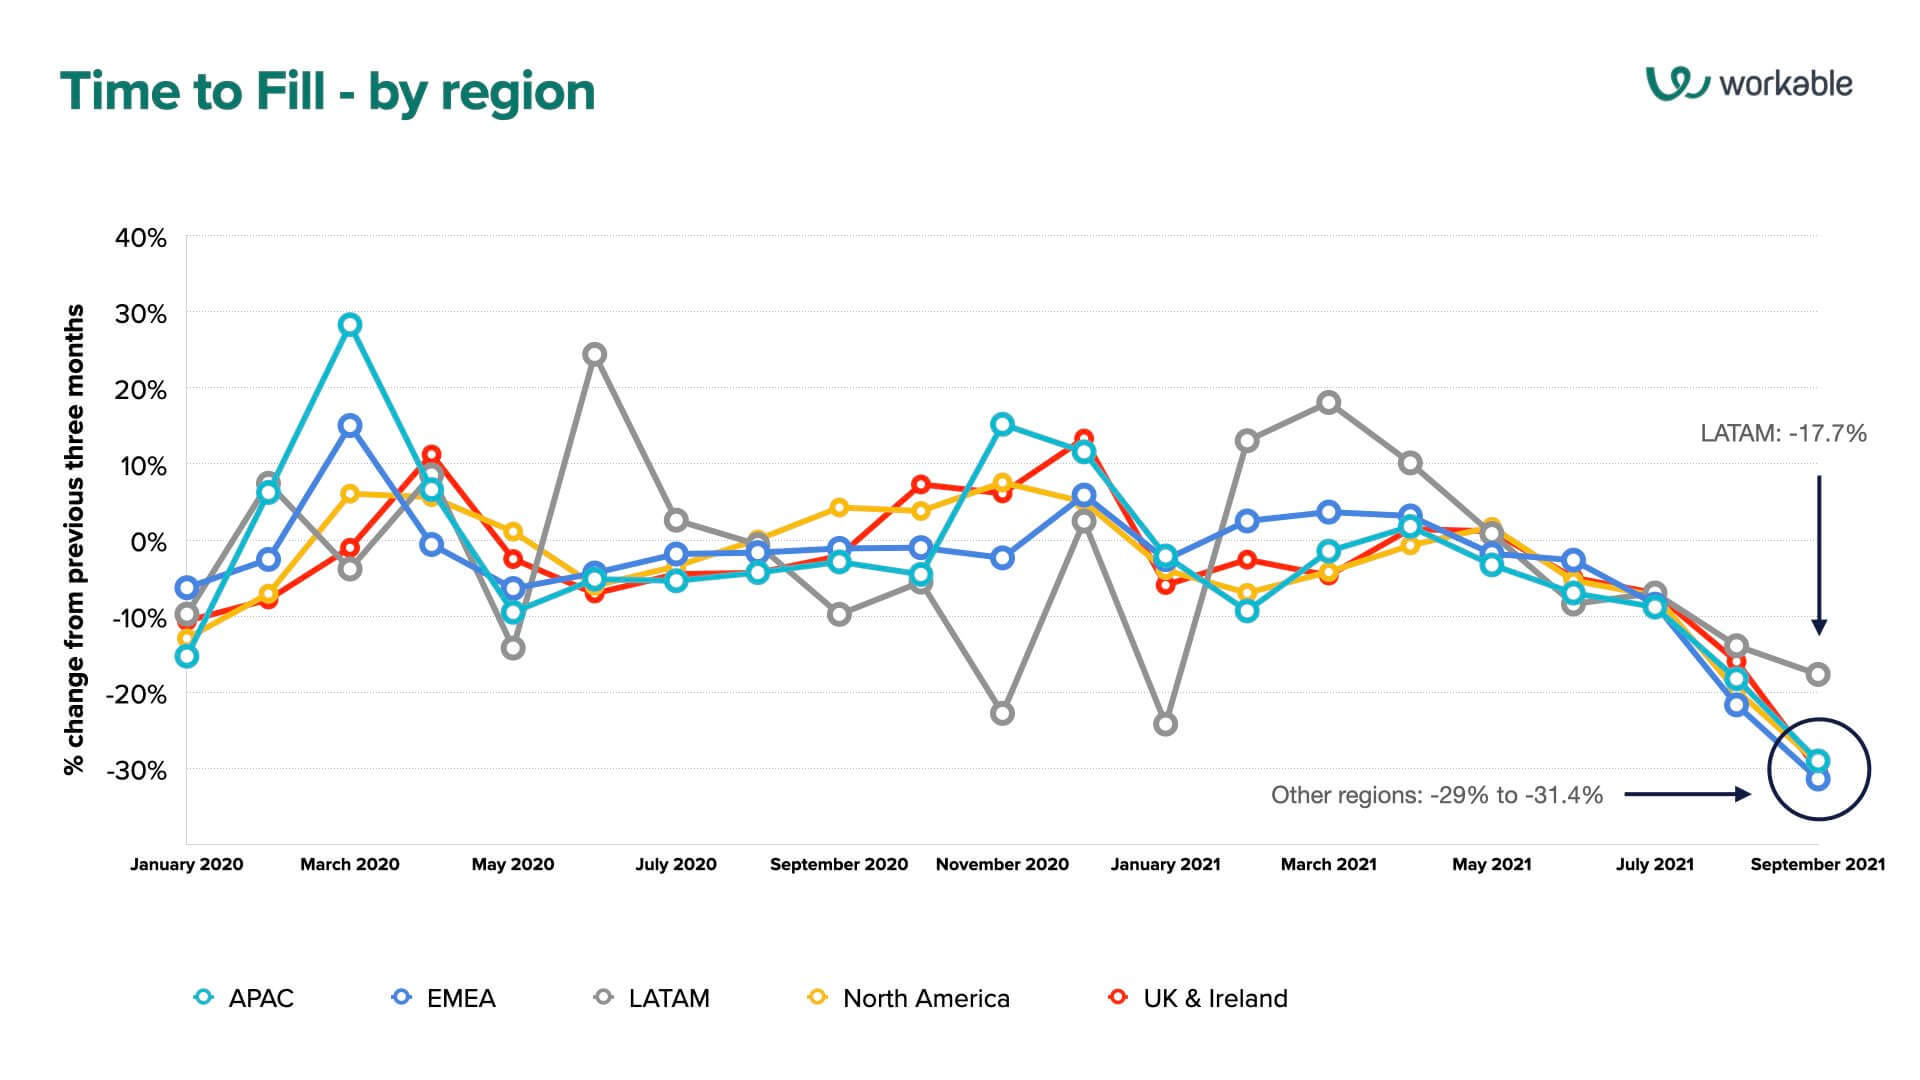
This one’s interesting – we see a lot of differences across regions especially in March 2020, during the last quarter of 2020, and the first part of 2021, all coinciding with massive spikes in COVID cases for each of the time periods in different areas.
Correlation doesn’t mean causation, of course. Instead, it’s just interesting how the numbers start to “reconcile” during Q2 and Q3 of 2021.
There’s one significant outlier though: the Latin America group, which has a much less pronounced drop in Time to Fill (-17.7%) than the other four regions (-29% to -31.4%). Keep that in mind as we move to the next metric.
Total Job Openings
Now, the job openings across these five regions:
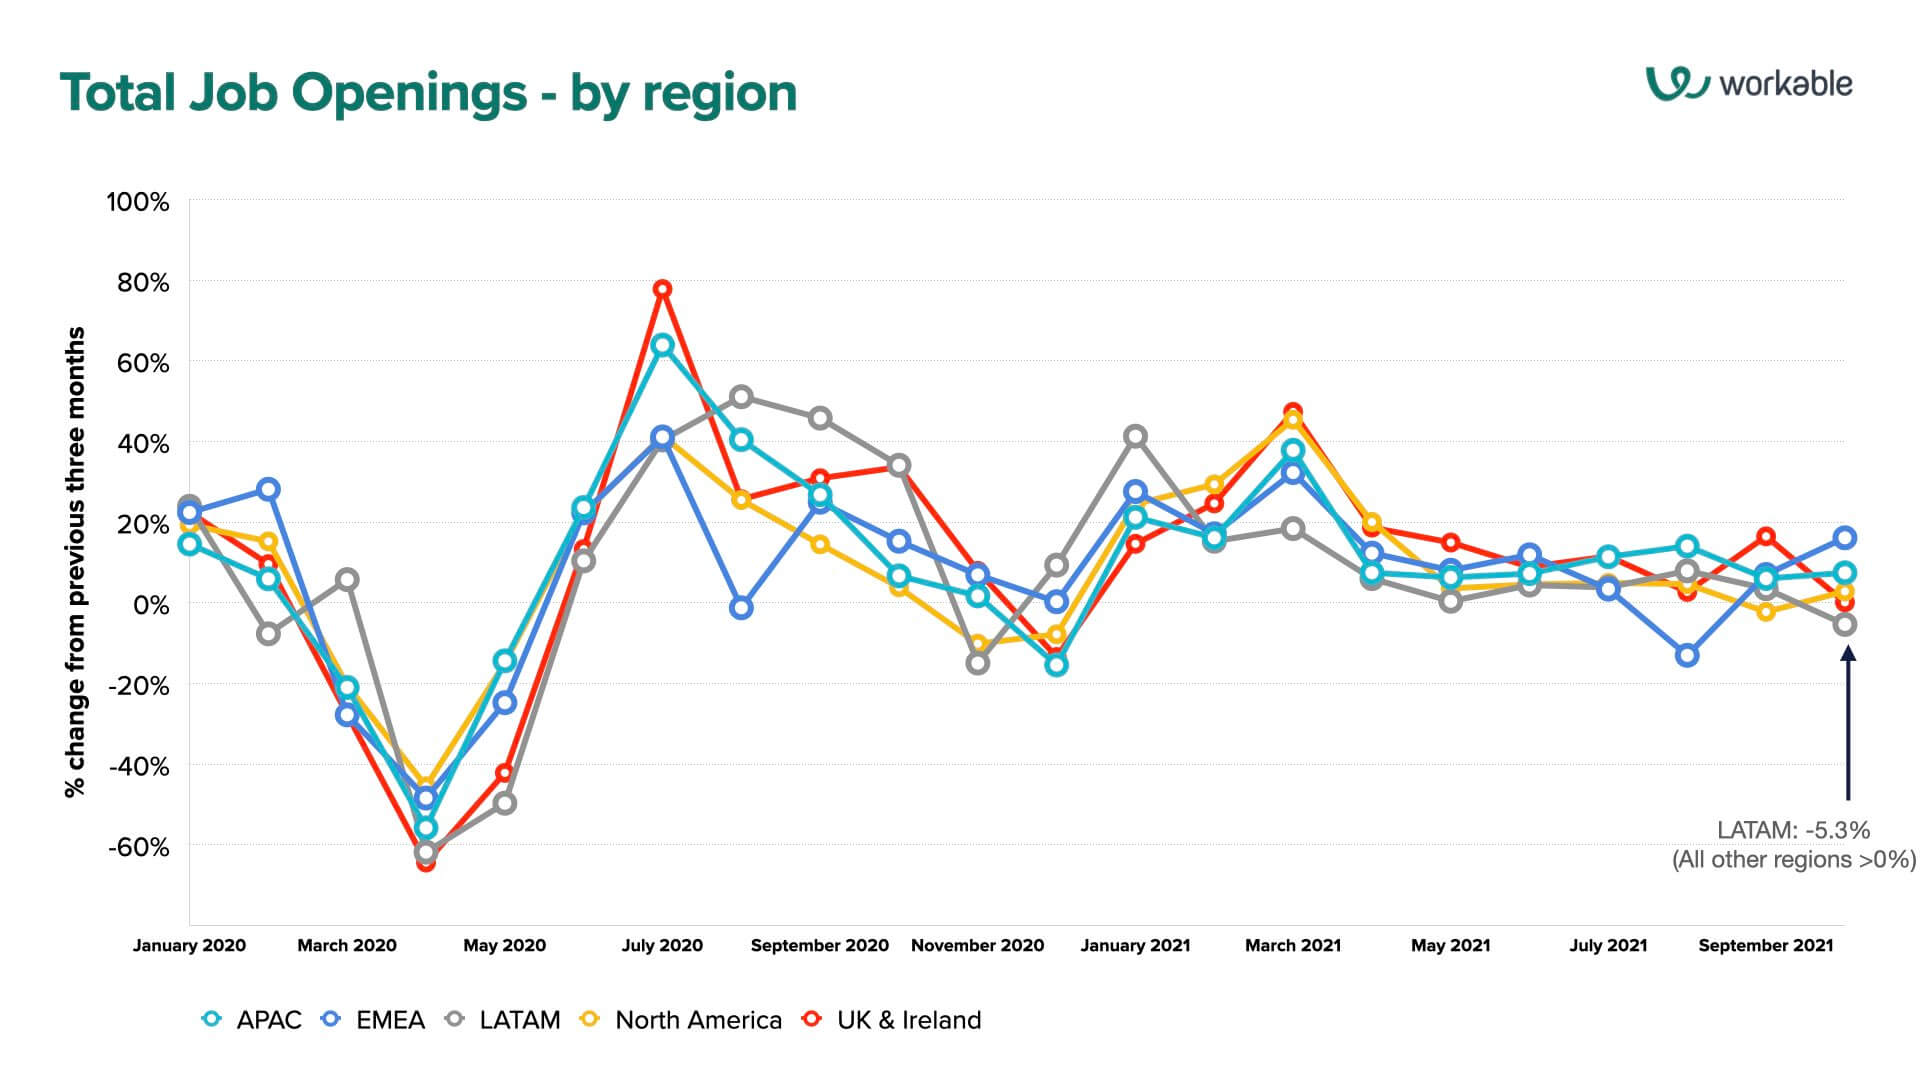
Of course, COVID was felt worldwide, as plainly obvious in the drop in job opens during March-April 2020. That aside, while the trends look similar across all five regions from afar, there are notables to point out here.
First, after a sudden drop in job opens in August 2021 (-13%), EMEA is seeing a positive trend of job opens over the last two months (7% and 16.1%).
Second, UK & Ireland saw significant upward trend in job opens in September 2021 (16.5%) before leveling out at 0.1% for October.
And finally, Latin America is the only one of the five regions seeing a negative trend in job openings, with a -5.3% drop in October, standing in stark contrast to the other four regions.
Candidates per Hire
Finally, let’s look at Candidates per Hire across the five regions.
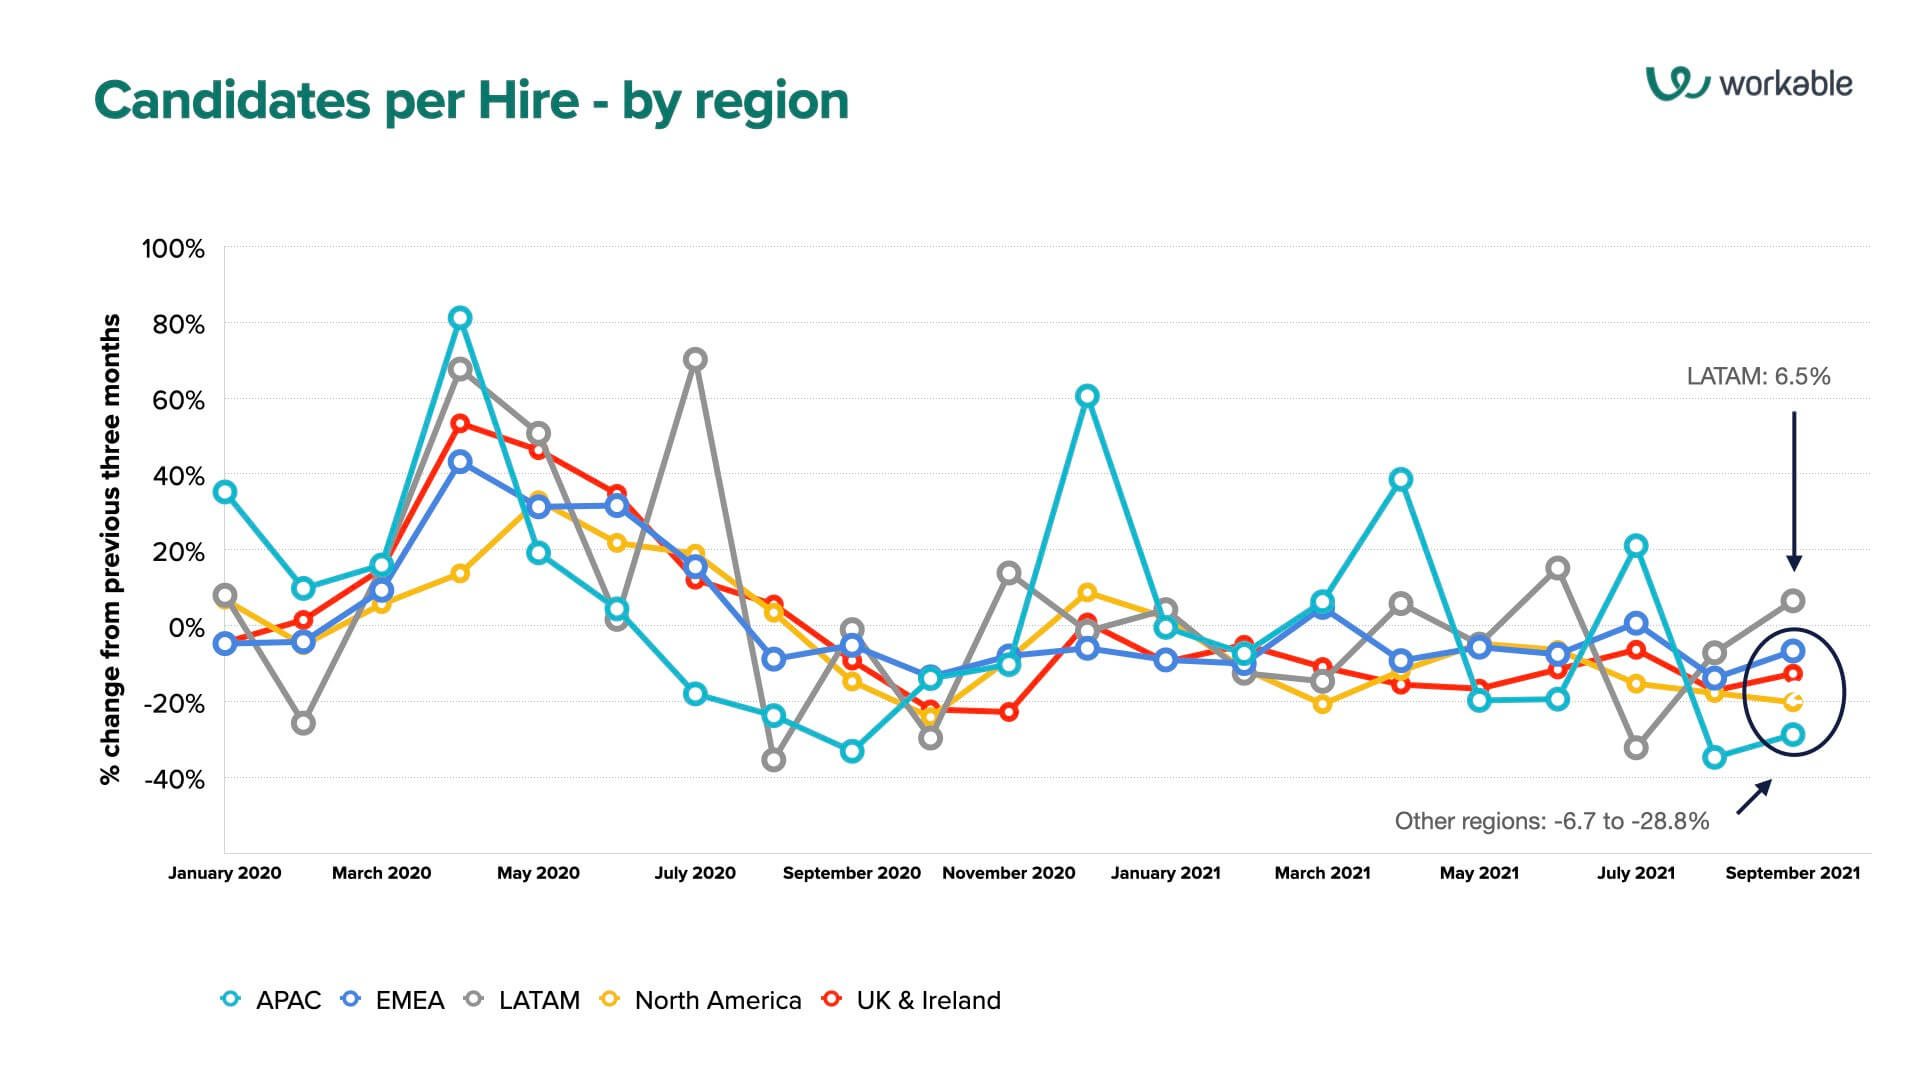
Unlike the other two metrics which saw more closely aligned trends across regions, this one is more dramatically scattered with job quits, layoffs, business closures, strikes, and other factors differing significantly as the pandemic continues its waves throughout the world.
For instance, UK & Ireland saw consistently negative trends in every single month dating back to August 2020 – with the tiny exception of December 2020 where it nosed above the surface to .8% before going under again.
Meanwhile, businesses in North America also saw negative trends in every month dating back to the summer of 2020 with spikes in CPH trends in December 2020 (8.7%) and January 2021 (2.1%).
EMEA, meanwhile, jumped a bit in March 2021 (4.8%) and July 2021 (.6%), but otherwise saw regular drops in its CPH metric as well. APAC spiked in December 2020, April 2021, and July 2021 – likely due to seasonality – but otherwise stayed in the negatives.
Latin America, again, stands out – where the other four regions stayed negative, LATAM businesses saw a sharp 6.5% increase in the CPH trend compared with the previous three-month average, the only one of the five to see a positive upward trend in that metric.
Does this mean more people are looking for work there and not finding enough? Perhaps – especially with dismal news out of Brazil, LATAM’s largest economy, of a faltering economic landscape and predictions of a recession in 2022.
Conclusion
Last month, we predicted that once reliable data for September became available, we would see it as a catalytic month as a result of children returning to school, a shortage of childcare workers in the U.S., and potential economic fallout coming from the Delta variant.
We didn’t see the fallout from Delta – the opposite, in fact, since Delta was already on the wane – but there are still fears of a resurgence of the virus due to winter seasonality, waning immunity levels among the vaccinated, and overall increased mobility according to the Institute for Health Metrics and Evaluation (IHME) in Washington.
That being said, the TTF metric is decreasing, job opens are on the rise – and we’re seeing a modest slowdown in CPH’s decline. Does that last metric mean people are starting to look for work again after quitting en masse during the Great Resignation? Maybe, maybe not. Regardless, SMB employers are still very worried.
One thing’s clear – different regions see different trends that impact hiring. That’s worth keeping in mind, especially if you’re an international employer or you’re hiring globally.
And no matter where you are, it’s always worth thinking about your ideal candidate profile, fine-tuning your recruitment marketing strategy, and really targeting those candidates so you can stay ahead of the trends.
Thoughts, comments, disagreements? Send them to [email protected], with “Hiring Pulse” in the subject heading. We’ll share the best feedback in an upcoming report. Watch for our next Hiring Pulse in December!
The Hiring Pulse: Methodology
To bring the best insights to small and medium businesses worldwide, here’s what we’re doing with our data: when looking at a specific month’s trend, we’re taking the numbers from that month and comparing it to the average of the three previous months – and showing as a percentage how that month looks in comparison.
For example, if July shows an average Time to Fill of 30 days for all jobs, and the monthly average for the three preceding months (April, May, June) is 25 days, we present the result for July as a 20% increase.
The majority of the data is sourced from small and medium businesses across the Workable network, making it a powerful resource for SMBs when planning their own hiring strategy.